What are learning analytics?
Learning analytics encompass data measurement, analysis, and reporting about employees as they progress through L&D programs and the application of learning over time. Having this information at your fingertips will help your team understand learning activity, skill gaps, key performance improvement, and historical impact over time. The data can also identify high-potential individuals, readiness for promotion/succession, and understanding how to keep critical positions from being at-risk due to lack of skilled or certified resources that can do them. Learning analytics information will also help reveal shortcomings in programs that businesses can address to optimize learning and enterprise-wide employee development.
In other words, the data can help you draw a straight line from the impact of learning activities to the very real business outcomes they produce.
Begin with a Strong Foundation
Assess your workforce to understand current performance levels, looking specifically for gaps that point to areas where individuals, teams or even whole departments may be falling short of expectations. Collecting and utilizing trustworthy data as the starting point for evaluation is key.
Once you’ve identified the gaps that exist, work to develop a learning and development strategy with related activities to address those gaps so that individuals have support as they move in and out of roles and responsibilities.
Try taking a “backward” approach to develop training: start with the desired outcome and use it to define the solution. This will help you create a program that provides real value to your organization. Additionally, this approach will provide you with an effective learning analytics framework. It will define the outcome you need to measure and the touchpoints and variables during the program that can alter that outcome. For example, if you want to document “what great looks like”, you need to identify the specific data points that make up “great” for your organization and the specific roles within it. Once you have that data identified and know your criteria for identifying “great”, then it is time to put into place accountability and measurement for training leadership, managers and the employees themselves to know what to look for, what is expected and how to support one another in lifting the baseline expectation for performance.
Once you have training in place, implement and collect data to track results from your L&D programs. Make plans to regularly monitor and measure these analytics over time to adjust your efforts and ensure success for your teams. Accountability and small adjustments throughout the course of your L&D program will go a long way towards using your analytics to effect positive outcomes.
How to Build a Learning Analytics Strategy
To effectively define the current state, gaps, and how well your L&D program addresses them, you need to collect, manage, and aggregate data. Work with your IT team and data analytics solution provider to understand the relationships between systems, such as talent, HR, operational data, financial systems, and even employee surveys.
In general, you can divide data into three buckets:
- Activity: related to the L&D program itself
- Experience: revealing employee knowledge or skills and engagement before and after participation in the program
- Performance/Outcomes: changes that can be traced to the program
Ensure that you have relevant data from each category to help build an accurate picture of your L&D program’s effectiveness. The business must have an answer to questions like “how will you collect data from each of the activities above?” and “where will that data go, and how will it be tracked over time?”
Also, remember that data related to employee skills and performance is sensitive, and you must protect it. A critical part of establishing your learning analytics strategy is data governance, setting policies that protect data integrity and ensuring employee privacy.
Another key element of your learning analytics strategy is to generate actionable insights. The data you collect should tell a story that shows how your program led to change. Think of this like a science experiment: make a change and then track and record the impact that change had on the business. If it was positive, do more of it. If it was negative or even neutral, you may want to adjust or try something different. It may also be beneficial to identify touchpoints or milestones that can uncover which parts of the program are successful and which should be adapted for better results. Resist the temptation simply to base L&D program effectiveness on employees achieving certifications. Find ways to show real change, learning, and skill development. This might include adjustments to long-term KPIs to raise the expectations on employees who participated in L&D programs. Adjusting these KPIs can show skill retention rates and development over time.
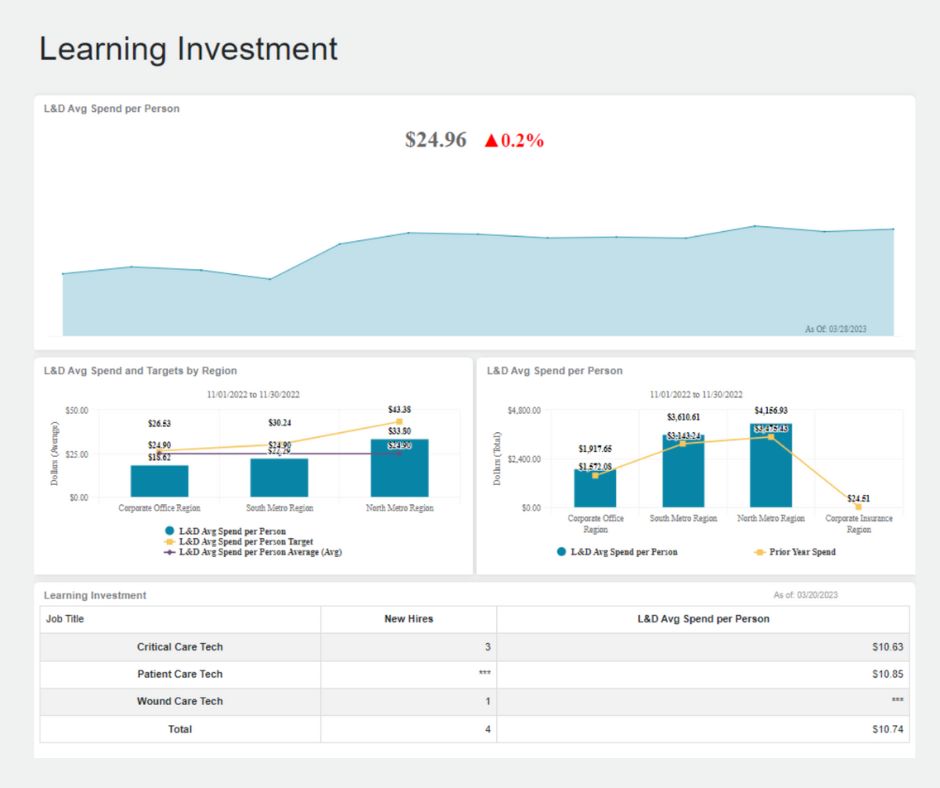
You can add another dimension to your learning analytics strategy by exploring the value of predictive analytics, which generate likely outcomes, rather than only descriptive analytics, which provide current or historical information. With that said, all the data you collect from your L&D program can help you understand which employees will benefit most from your programs and which employees are most likely to need assistance to complete L&D initiatives. One dashboard example:
Which Metrics and KPIs to Monitor
Although the key performance indicators (KPIs) you need to track to gain insights for your specific program will vary, metrics for any L&D program include:
Course completion
This is a basic metric, but it’s fundamental to know whether the employee actually completed the course. Low completion rate can point to disengaged employees or courses that don’t align with your processes and systems.
Average time to completion
A fast time to completion across the board can indicate that the course is too easy or that employees aren’t embracing the program. Track average time for top-performing employees versus their peers to gain deeper insights into success metrics for individualized L&D plans. When an employee takes the time they need to complete the course, retention will be higher which impacts your business’s bottom line.
Post-training assessment results
Every course should have an assessment that gauges learning or skill development. Tracking this data as well as employee performance before and after the course can provide insights into the program’s effectiveness. These metrics can also help you tailor future L&D programs to your teams’ needs.
Learner retention rate
An assessment immediately after the program may not provide a complete picture of how it impacts the employee’s performance long term. Devise a way to check how much the employee has retained after some time has elapsed. Good retention rates lead to better business results.
Performance impact
Depending on the objectives of your L&D program, consider tracking, for example, productivity, error rate, or product quality before and after employees take the course. This can help you gauge the effectiveness of your L&D efforts.
Training ROI
Calculate the costs of the program and compare them to business outcomes in dollars and cents to show the financial impact of the program. This can help you continue to create high-quality L&D programs that drive measurable results for your business.
Learning Analytics Challenges
As you create and execute your learning analytics strategy, you’ll need to overcome some common challenges. First, the data you need will be dispersed across multiple systems, so you’ll need to build a data pipeline that moves data to your data dashboard and analytics system. Next, you will also need to validate data and prepare it for analysis – data quality impacts the quality of the insights about your L&D program.
Finally, the current state is always changing, so you need to create a system that’s capable of handling a dynamic environment. The best system will provide all the functionality you need in one tool, rather than a system of multiple tools that creates complexity, inconsistencies, and limited visibility.
The Best L&D Departments Rely on Their Analytics Dashboard
A learning analytics dashboard backed by analytics services from an experienced provider can help you overcome challenges and easily monitor the effectiveness of your L&D program. A dashboard will sit on top of one or more sources of data to surface visualizations and enable you to share insights with your organization and leadership. Your service provider can help you build your data pipeline, clean, and organize data, so that you can tie learning to people, performance, DEIB initiatives, career advancements, employee engagement, and more – not just whether an employee completed a course.
Before the era of big data, there was little visibility into the impact L&D programs had on business outcomes. And unfortunately, many businesses are still not equipped to determine the impact these programs make today.
The right strategy, tools, data, and metrics will help create an effective program and provide you with insights that show L&D is impacting business outcomes.
Contact us to learn more.