While businesses become more adept at capturing big data, few are really leveraging data’s predictive power because they fail to take into account the context of that information.
But that doesn’t stop them from producing charts and graphs to depict data. Don’t get us wrong – these graphics are useful for depicting both simple and complex measures. However, they often stop short of telling the whole story. Without context, people may not fully grasp what you’re trying to convey. Even worse, removing the context from data can also remove its accuracy and reliability.
Putting the Pieces Together
Data analytics can create valuable insights, but those insights rely on having a specific context in mind. Otherwise, we are left with nothing but estimates and generalized conclusions. Businesses can become blindsided by the huge amounts of data at our fingertips, but it is dangerous to let this data inform our decisions without stopping to think of its context.
For example, consider the numbers themselves. Statistics is a science of estimation, meaning the numbers you see aren’t really an exact count. Simply shifting the criteria of what was counted can change the numbers entirely, so there’s always a level of uncertainty attached to your data. It’s the data scientist’s job to minimize that uncertainty, which can be achieved, in part, by applying context.
Have you ever read one of those “Happiest State” or “Healthiest City” studies? Don’t they have more impact when you know which people, factors, etc. were used to determine the numbers? Context can make the difference between simply seeing a graph or statistic and understanding the information behind it well enough to take action upon it – for example, adopting public health initiatives that have been successful in other cities.
Bringing Big Data into Context
To preserve context for a data object, you need to know where the data is from, as well as when that data will “expire”, or become too old to be relevant. If this context is not preserved, your analysis created from that data can become stale.
When aggregating data sets, context boils down to capturing the reasons that went into selecting the data. For example, you might consider which possible data objects could have been included, why the ones included were chosen, and what you learned from inspecting all the data. Understanding the context of your data and sharing it with others will provide confidence that everyone is basing decisions upon relevant and timely information.
Contextual analytics allows businesses to find patterns and trends and helps them to build predictive models and create business strategies. Context makes the difference between a big data and “smart data.” The business value of context is that you know more about your data and can trust it.
Visualizing the Context
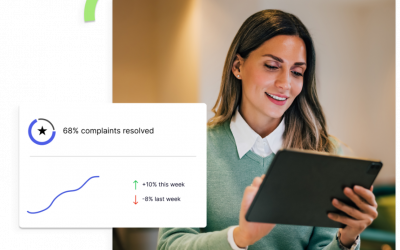
The most successful dashboards today put information into context to allow companies to tell a story with their data. Users that are “in the know” about why a particular measure is trending one way or another can provide analyst guidance that helps transfer what they know to everyone else.
And that’s the key value of context – you know what you have. The more context that you can provide to people, the better they can understand the data and use it to make informed decisions.