Solutions ────
Data Visualization & Analytics
Empower users with smart dashboards and AI-driven insights for faster decision-making
Intelligent Workforce Decisions
Powered by Predictive Insights
Visualization & Analytics for Smarter Decisions
Adaptive Metrics and Dashboard Reporting
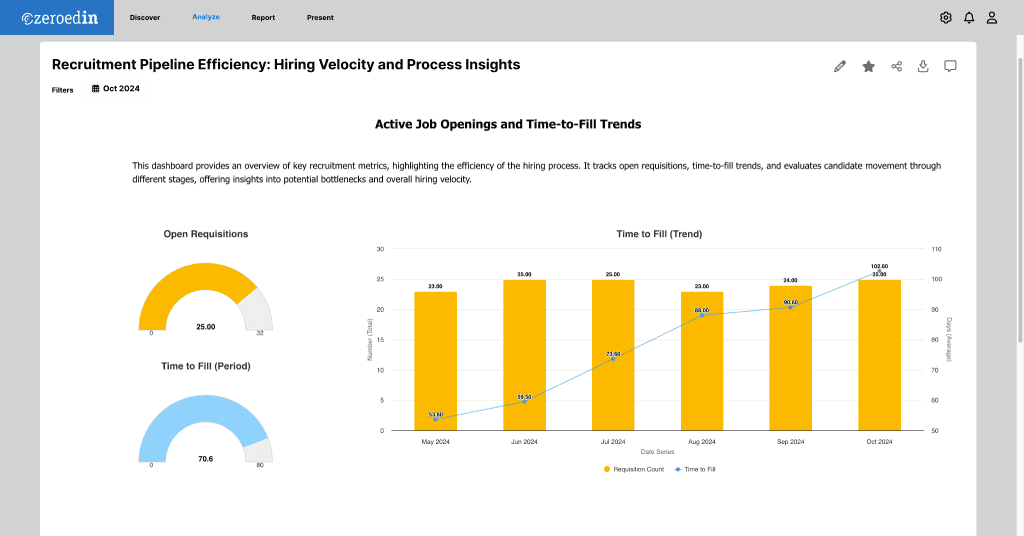
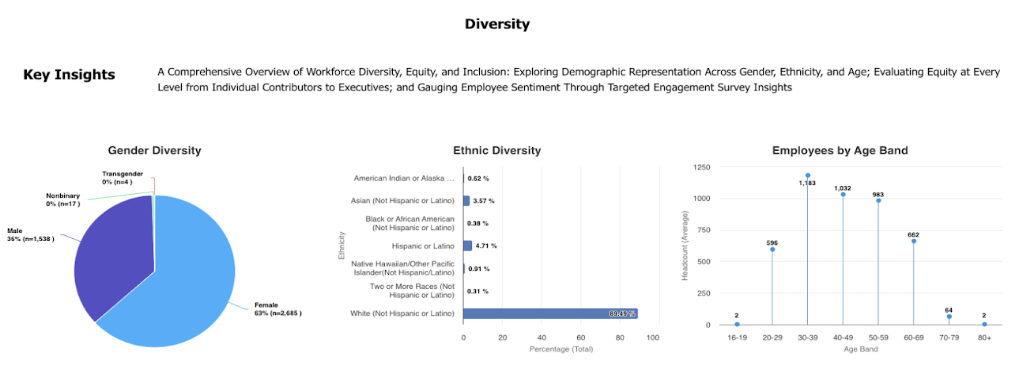
Turning raw numbers into clear insights is at the heart of effective decision-making. ZeroedIn’s data visualization tools help you move from static reports to interactive dashboards that make complex workforce and HR data easier to understand. Our platform enables you to visualize trends, spot opportunities, and share compelling storytelling visuals with your audience.
Leverage a suite of intuitive metrics and dynamic workforce and hr dashboards that evolve with your organization. Tailor these elements to meet changing needs and make real-time adjustments.
Predictive Insights Tool
Utilize the power of AI-driven analytics to predict future workforce needs, enabling strategic planning and ensuring compliance. Gain the foresight needed to remain ahead in a competitive landscape.
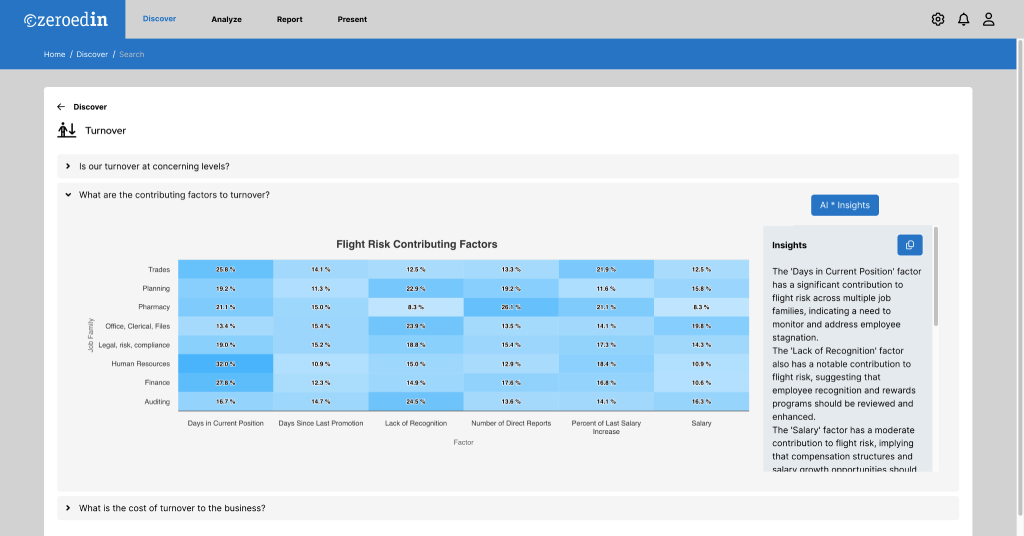
Predictive analytics uses historical and real-time data to forecast what’s ahead. With ZeroedIn, you can:
- Identify potential workforce gaps before they impact productivity.
- Model different scenarios for strategic workforce planning.
- Ensure compliance by monitoring and predicting trends.
- Transform complex datasets into clear visual presentations for leadership.
This is more than just making data visible—it’s about making it actionable.
Leadership & Organizational Insights Tool
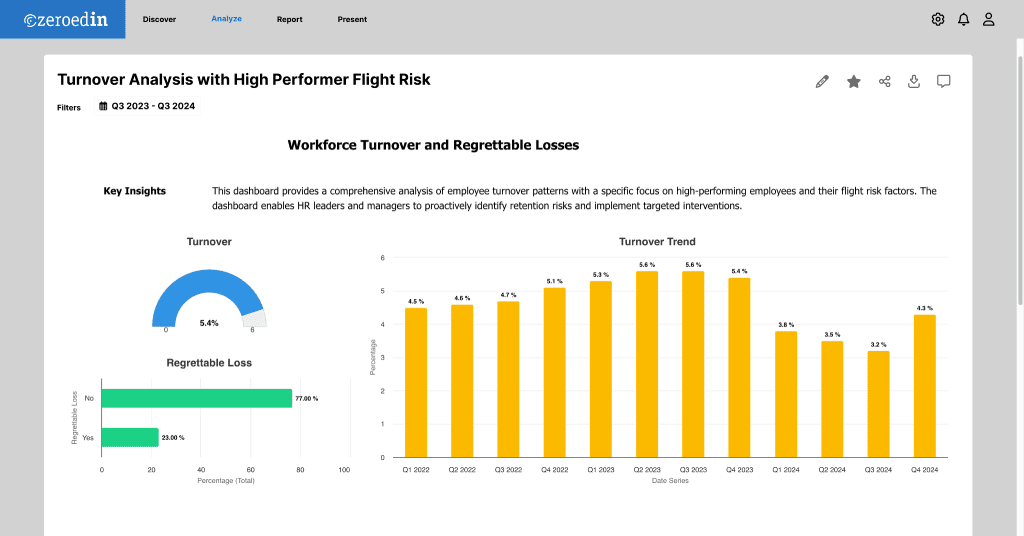
Optimize span of control and identify leadership gaps with predictive modeling to address future needs. Gain insights that support seamless transitions, proactive talent development, and a resilient organizational structure.
Strong leadership structures are essential for organizational success. Our tools help you:
- Visualize your span of control with detailed maps and diagrams.
- Highlight leadership strengths and areas for development.
- Track progress in talent analytics solutions.
- Prepare for transitions with predictive modeling.
By visualizing data in ways your audience understands, you can make confident decisions about the future of your organization.
Leadership & Organizational
Insights Tool
Optimize span of control and identify leadership gaps with predictive modeling to address future needs. Gain insights that support seamless transitions, proactive talent development, and a resilient organizational structure.
Strong leadership structures are essential for organizational success. Our tools help you:
- Visualize your span of control with detailed maps and diagrams.
- Highlight leadership strengths and areas for development.
- Track progress in talent analytics solutions.
- Prepare for transitions with predictive modeling.
By visualizing data in ways your audience understands, you can make confident decisions about the future of your organization.
Enhanced Organizational
Agility Insights Tool
Quickly adapt to the evolving demands of the business environment with agile tools and insights. Stay responsive to change and maintain a competitive edge through flexible data management and analysis.
In fast-changing environments, agility is a competitive advantage. Our analytics software supports:
- Rapid updates to visual dashboards when priorities shift.
- Consolidation of multiple data sources into one central view.
- Real-time tracking for projects, performance, and workforce allocation.
With the ability to transform raw numbers into meaningful visuals, you can adapt quickly and maintain alignment across teams.
Data Visualization Tool: Adaptive Metrics and Dashboard Reporting
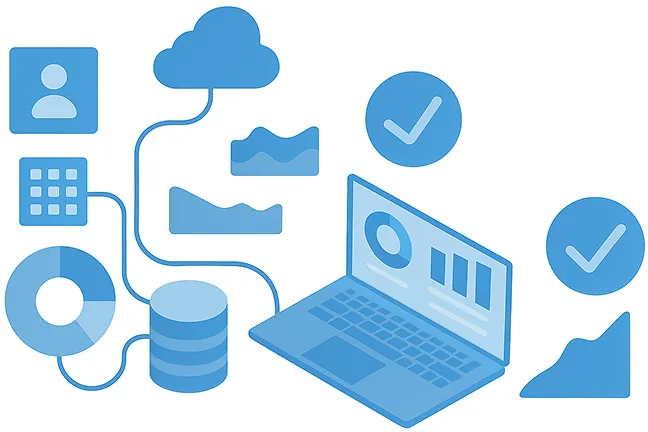
Our data visualization software adapts as your organization grows. The platform supports:
- Dynamic HR dashboards tailored to your data sources.
- Custom metrics that you can update in real time.
- A gallery of interactive visuals to fit your presentation style.
- Seamless integration with spreadsheets and HR systems for unified reporting.
With an emphasis on ease of use, even non-technical users can create polished visuals that bring data stories to life.
Data Visualization Tool: Adaptive Metrics and Dashboard Reporting
Our data visualization software adapts as your organization grows. The platform supports:
- Dynamic HR dashboards tailored to your data sources.
- Custom metrics that you can update in real time.
- A gallery of interactive visuals to fit your presentation style.
- Seamless integration with spreadsheets and HR systems for unified reporting.
With an emphasis on ease of use, even non-technical users can create polished visuals that bring data stories to life.
Frequently Asked Questions
How does ZeroedIn present data for HR and workforce analytics?
ZeroedIn’s data visualization tools provide interactive dashboards, charts, and visualization techniques designed for HR leaders. You can easily present data on employee performance, engagement, and retention trends in ways that are understandable and actionable.
What makes ZeroedIn’s data visualization effective for business decisions?
Effective data visualization combines accurate metrics with clear visuals. ZeroedIn uses interactive visualizations such as bar charts, timelines, and geographic maps to help executives quickly interpret workforce trends and plan strategically.
Can I create data visualizations without technical skills?
Yes. ZeroedIn’s platform is easy to use, offering pre-built templates, drag-and-drop tools, and customization options. HR teams can create effective visualizations without coding or scripting.
What types of visualizations are available?
You can choose from a wide range of types of visualizations, including bar charts, pie charts, trend lines, and maps. Each type of chart is optimized for specific HR insights, such as tracking headcount changes or mapping skill gaps.
Can I import and integrate specific data from other systems?
Absolutely. You can import HR and workforce data from spreadsheets, HRIS, and other third-party systems. The platform can also embed visuals into reports, presentations, or portals.
How does ZeroedIn help tell stories with data?
Our platform supports data-driven storytelling by combining visualizations with context. Dashboards can display trends over time, highlight KPIs, and use annotations so leaders can tell stories that drive informed action.
Are the visualizations mobile-friendly?
Yes. Dashboards are optimized for mobile viewing, making it easy for executives and managers to review metrics and interact with charts from any device.
How does predictive analytics fit into data visualization?
The predictive insights tool uses historical and current data to forecast future trends. Visual outputs like graphs and curves make it easy to see what’s ahead and prepare for staffing or organizational changes.
Where can I learn more about data visualization with ZeroedIn?
You can learn more about data visualization methods and capabilities by booking a personalized demo. We’ll walk you through the platform’s capabilities, from choosing the best chart type to customizing your dashboard for your audience.

Get Started with ZeroedIn
Ready to unlock your full workforce potential? Speak with a product expert today and see how ZeroedIn can revolutionize your people analytics strategy.

